News’ Sentiment Visualization
Alternative data has become a key element to enhance financial databases. Especially, news flows are one of the most spread alternative types of data.
In this article, our purpose will be to show how we can access to this kind of data and how we can leverage on it. In this extent, we will propose a data vizualization of the news’ sentiment.
This vizualization will be a word cloud referencing the most spread buzzwords of the moment. We will customize it with sentiment analysis to indicate which words are used in a positive context and which are not.
The idea is to retrieve some newspaper titles from a web API called “News API” (https://newsapi.org/), which allows us to request articles from a lot of sources. The API is free for development use, we can request articles that are less than 1 month old (more for commercial uses). For our example we will parse news headlines, for the last month, from two datasources: bloomberg and the wall street journal.
First we import a bunch of libraries that we will be using:
import nltk
import pandas as pd
import numpy as np
import time
import dateutil
import string
from nltk.corpus import stopwords
from nltk.tokenize import sent_tokenize
from nltk.sentiment import SentimentIntensityAnalyzer
import matplotlib.pyplot as plt
from tqdm import tqdm
from wordcloud import  WordCloud, ImageColorGenerator, get_single_color_func
import urllib.request
from bs4 import BeautifulSoup
from datetime import datetime, timedelta
import time
import ssl
import json
We will use urllib library to send requests to the API:
proxy = urllib.request.ProxyHandler({'https':'https://your-proxy-address-if-you-have-one.com:port'})
opener = urllib.request.build_opener(proxy)
opener.addheaders = [('User-agent', 'Mozilla/5.0 (Macintosh; Intel Mac OS X 10_9_3) AppleWebKit/537.36 (KHTML, like Gecko) Chrome/35.0.1916.47 Safari/537.36')]
urllib.request.install_opener(opener)
To estimate the sentiment of the news data, we will be using NLTK library (https://www.nltk.org/), which is a natural language toolkit for text processing. Here we ask, for each day of the last 25 days, the most popular articles from the selected data sources. From the title of the articles we compute a “polarity score” which represents the overall sentiment of the title. Finally we store the data for later use.
apikey = "xxxxxxx" # the news api key
dates_list = [(datetime.now()-timedelta(days=i)).strftime('%Y-%m-%d') for i in range(25)] # we request last 25 days
sid = SentimentIntensityAnalyzer() # we instantiate the sentiment analyzer
data_news = pd.DataFrame(columns=['Title','Description','Content','PublishedDate','Url','Source'])
for i in tqdm(dates_list):
    url = 'https://newsapi.org/v2/everything?from='+i+'&to='+i+'&sources=bloomberg,the-wall-street-journal&sortBy=popularity&pageSize=99&apiKey='+apikey

    page = json.load(urllib.request.urlopen(url))

    for pg in page['articles']:
        try:
            data_news = data_news.append({'Title':pg['title'],
                                      'Description':pg['description'],
                                      'Content':pg['content'],
                                      'PublishedDate':pg['publishedAt'],
                                      'Url':pg['url'],
                                      'Source':pg['source']['name'],
                                      'Sentiment':sid.polarity_scores(pg['title'])['compound']},ignore_index=True)
        except:
            data_news = data_news.append({'Title':pg['title']},ignore_index=True)

    nb_articles = len(page['articles'])
    if nb_articles == 0:
        nb_articles = 1
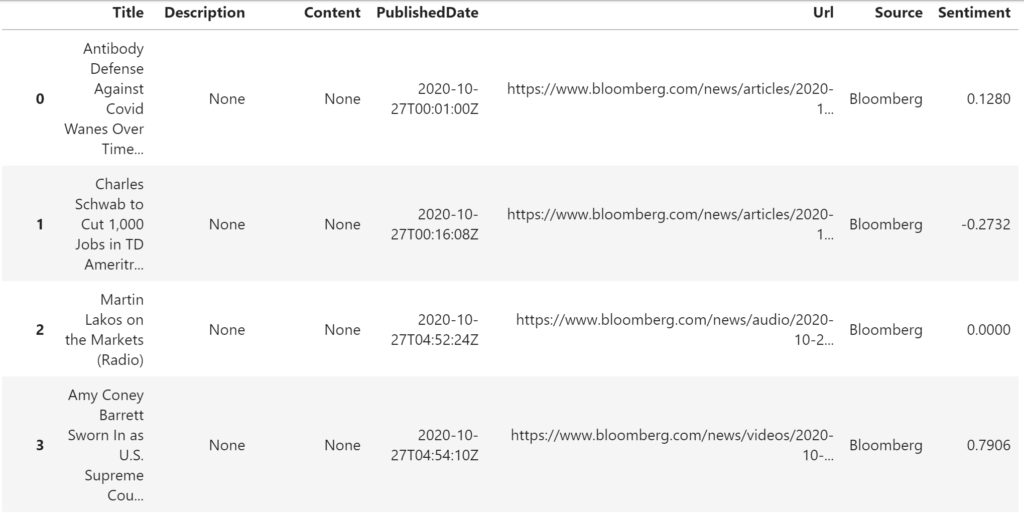
Our dataframe “data_news” looks like this:
Now we must clean a bit our data. As said before, for this exercice we will be using title data. It is made of phrases and we would like to isolate buzzwords, excluding what is called “stop words”. Below, we join all titles together and erase the stop words as well as recurring words with little interest for us.
text = " ".join(nw for nw in data_news.Title.dropna())

#stopwords
stop_words = stopwords.words('english')
new_stopwords = ['(Radio)', 'radio', 'Daybreak', 'daybreak' ,'Bloomberg', 'bloomberg','(Podcast)', 'podcast', 'Podcast', 'Radio',
                 'Market', 'market', 'after', 'After','billion', 'first', 'First', 'Start', 'start', 'Daybreak:', '\'Bloomberg',
                 'second', 'Second', 'years', 'still', 'Still', 'could', 'Could', 'about', 'About', 'against', 'Against', 'Street', 'street',
                 'Markets:', 'Markets', '-Market', 'Billion', 'billion', 'Million', 'million', 'Stock', 'stock', 'state', 'State', 'Journal',
                 'Record','Business']
stop_words.extend(new_stopwords)
stop_words = set(stop_words)

#delete stopwords
clean_text = [word for word in text.split() if word not in stop_words]

#list to string
text = ' '.join([str(elem) for elem in clean_text])
With our titles merged and cleaned, we will plot a first basic wordcloud, to show the 20 most used words. We will be using the world cloud generator from http://amueller.github.io/word_cloud/:
wordcloud = WordCloud(background_color="white", max_words=20, min_word_length=5).generate(text)

# visualize the image
fig=plt.figure(figsize=(10, 8))
plt.imshow(wordcloud, interpolation='bilinear')
plt.axis("off")
plt.show()
For these 20 words, we want to know if they are used in a positive or negative context. As an example, we define the following rule: for each word, if the sentiment score of positive sentences, where it is included, is superior to the sentiment score of those negative sentences, then it is mapped as positive word (the opposite if inferior):
top20words = list(wordcloud.words_.keys())
data_news_cleaned = data_news.dropna(subset=['Title']).copy()
good_list = np.array([], dtype=str)
bad_list = np.array([], dtype=str)
for i in range(len(top20words)):
pos_stat = data_news_cleaned[(data_news_cleaned.Title.str.contains(top20words[i])) & (data_news_cleaned.Sentiment > 0)].Sentiment.mean()
neg_stat = data_news_cleaned[(data_news_cleaned.Title.str.contains(top20words[i])) & (data_news_cleaned.Sentiment < 0)].Sentiment.mean()
ratio = np.abs(pos_stat / neg_stat)
if ratio > 1:
good_list = np.append(good_list,top20words[i])
elif ratio < 1:
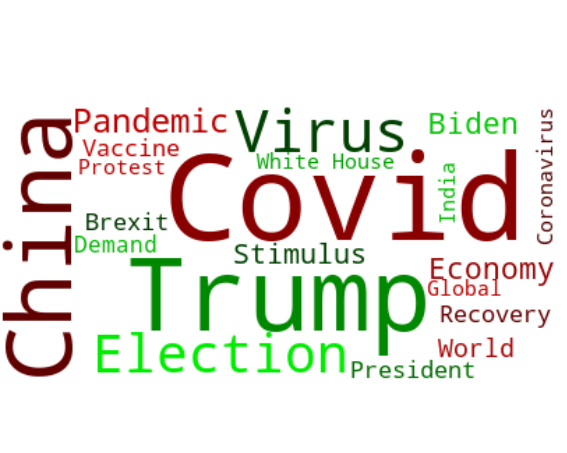
bad_list = np.append(bad_list,top20words[i])Now we use the function taken from the library examples “GroupedColorFunc”, and plot the wordcloud with colours depending on sentiment:
class GroupedColorFunc(object):
    """Create a color function object which assigns DIFFERENT SHADES of
       specified colors to certain words based on the color to words mapping.
       Uses wordcloud.get_single_color_func
       Parameters
       ----------
       color_to_words : dict(str -> list(str))
         A dictionary that maps a color to the list of words.
       default_color : str
         Color that will be assigned to a word that's not a member
         of any value from color_to_words.
    """

    def __init__(self, color_to_words, default_color):
        self.color_func_to_words = [
            (get_single_color_func(color), set(words))
            for (color, words) in color_to_words.items()]

        self.default_color_func = get_single_color_func(default_color)

    def get_color_func(self, word):
        """Returns a single_color_func associated with the word"""
        try:
            color_func = next(
                color_func for (color_func, words) in self.color_func_to_words
                if word in words)
        except StopIteration:
            color_func = self.default_color_func

        return color_func

    def __call__(self, word, **kwargs):
        return self.get_color_func(word)(word, **kwargs)
color_to_words = {
# words below will be colored with a green single color function
'#00ff00': good_list,
# will be colored with a red single color function
'red': bad_list
}
# Words that are not in any of the color_to_words values
# will be colored with a grey single color function
default_color = 'grey'
# Create a color function with multiple tones
grouped_color_func = GroupedColorFunc(color_to_words, default_color)
# Apply our color function
wordcloud.recolor(color_func=grouped_color_func)
fig=plt.figure(figsize=(10, 8))
plt.imshow(wordcloud, interpolation="bilinear")
plt.axis("off")
plt.show()That’s it!
We were able to retrieve some text data on news, enrich the data with sentiment analysis and finally produce a vizualization.
Remark: The quality and cleaning of data can be, indeed, very much improved, but this was not the purpose of this article.